In the next steps, define a random input tensor with the shape of (2,3). See the difference when softmax is applied on the dimension-0 (dim=0) and dimension-1 (dim=1).
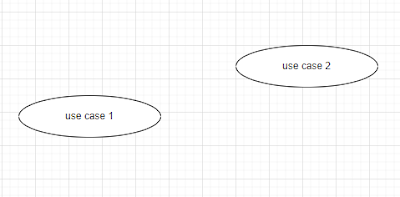
So, over the past two months, I was assigned to create use-case diagrams. I found a handy tool for this purpose i.e., draw.io . I never touched this type of diagram in my entire professional career. I learnt how to draw ones when I was in college, sure. But spending most of my time to date as a programmer or data engineer, I never got the chance to actually create one. It was clear that when I got this assignment, I was spending a substantial amount of time just figuring out how to include a dashed connecter (typically for representing "include" or "extend"). The funny thing is I could not find any clue of how to do this in their blog . So, here's how. Step 0: Initiation Suppose we have two cases: case 1 and case 2 ( I know it was a genuine mistake to name the two cases as use case 1 and use case 2 as shown below. Heck, I'm too lazy to update the pictures, so from now on we will assume the name of the cases are case 1 and case 2, respectively). We want to...
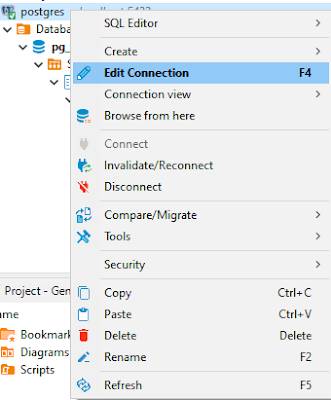
Recently, I encountered an error, saying: "Error: database already exists" This error came up when I thought the database I was trying to search was missing. So, I tried to create another new database with the same name. It's quite strange as on the Database Navigator pane at Dbeaver, the database remains hidden somewhere and the annoying this is we cannot create a new one. So, as always, I looked up Stackoverflow and find the workaround was rather simple. Right-click on the connection and fire Edit Connection Head to the PostgreSQL tab and make sure to tick the Show all databases on Click OK Problem solved! Credit to: oluwasegun for his response on the following StackOverflow thread: https://stackoverflow.com/questions/61979762/dbeaver-postgresql-error-database-already-exists-but-i-cant-find-it
Hi all, In this posting, I'm going to show how we can create a Python virtual environment using Windows Command Prompt (CMD). Here's the plan. I'm going to create a new folder named upwork where I will store all documents and source codes from Upwork projects. In this upwork folder, I will create a new python virtual environment named vupwork. I'm using Windows Command Prompt but I'm sure there will be more similar tutorials for you, non-windows users. Let's dive in! 1. Create your first virtual environment. The command would be in the following form: python[python_version] -m venv [your_venv_name] 2. Now, activate the newly created virtual environment using the following command: [your_venv_name]\Scripts\activate 3. Now, as your virtual environment is already activated, you may want to install some packages using pip. Let's try to add pandas! pip install [packages_to_be_installed] 4. Last thing: deactivate your virtual environment using the deacti...


Comments
Post a Comment